|
Proposed
Comprehensive Development at Wo Shang Wai, Yuen Long |
Mott MacDonald
Hong Kong Ltd. (“MMHK”) has been commissioned by the Contractor, Heng Shung Construction Co. Ltd., to undertake the Environmental
Team (ET) services to carry out environmental monitoring and audit (EM&A)
for both pre-construction and construction phases of the Proposed Comprehensive
Development at Wo Shang Wai, Yuen Long. From August 2016, the Project
Proponent, Profit Point Enterprises Limited, commissioned MMHK to continue the
ET services.
This is the
109th EM&A report submitted under the Condition 4.5 of
Environmental Permit No. EP-311/2008/E. This report summarises the findings on
EM&A during the period from 1 to 31 May 2019.
Exceedance
of Action and Limit Levels
There was
no breach of Action or Limit levels for Air Quality (1-hr TSP and 24-hr TSP)
and Noise level (as Leq) in the reporting
month.
The summary
of measured water quality is presented in Section 3.2.3.
Investigations
have been carried out to identify the causes of the exceedances. From
investigation, the Contractor has implemented water quality mitigation measures
as recommended in the EIA report. With external factors affecting the adjacent
environments, such as natural variations, the recorded exceedances of Water
Quality were considered not due to the project construction works.
Implementation
of Mitigation Measures
Site audits
were carried out on 2, 9, 16, 23 and 29 May 2019 to confirm the implementation
measures undertaken by the Contractor in the reporting month. The outcomes are
presented in Section 6 and the status of implementation of mitigation measures
in the site is shown in Appendix L.
Record of
Complaints
There was
no record of complaints received in the reporting month.
The major
site works scheduled to be commissioned in the coming three months include
regular maintenance work for the Wetland Restoration Area including lowering of
the water level and removal of unwanted species in the pond). No major
construction works will be carried out. Potential environmental impacts due to
the activities, including air quality, noise, water quality, ecology and
landscape and visual, will be monitored.
Environmental mitigation measures will be
implemented on site as recommended and weekly site audits will be carried out
to ensure that the environmental conditions are acceptable.
1
Introduction
1.1 Introduction
In March 2005,
the Project Proponent, Profit Point Enterprises Limited, acquired the
development site at Wo Shang Wai in Yuen Long. An Environmental Impact
Assessment (EIA) was then carried out and approved under the EIA Ordinance
(EIAO), and the Environmental Permit (EP-311/2008) for construction of the
comprehensive development in Wo Shang Wai was first granted by EPD on 9
September 2008 and has been subsequently varied, with the current version
(EP-311/2008/E) issued by EPD on 19 December 2017.
The Project
involves the residential development and associated infrastructure and wetland
restoration area and linear landscape area. The construction works under the
Environmental Permit commenced on 12 May 2010. The site formation construction
works of the Wetland Restoration Area (hereafter WRA) were completed on 15
November 2010 and the WRA was established by October 2012, within 30 months
from the commencement of construction as stipulated in the EP. This indicated
that planting works as scheduled in the approved Wetland Restoration and
Creation Scheme (WRCS; Nov 2009) were complete, except along the western and
southern boundary where the planting is affected by the existing site boundary
and noise barrier, and for which a Variation to Environmental Permit (EP-311/2008/C)
to defer planting at the location was approved. Consequently, EP
(EP-311/2008/D) including specific mitigation measures to minimise certain
identified noise impacts during the operation phase was approved. The current
valid EP (EP-311/2008/E) comprises varied conditions for the implementation and
maintenance of visual and landscape measures, and for the implementation of
noise mitigation measures.
Mott
MacDonald Hong Kong Ltd. (“MMHK”) has been commissioned by the Contractor, Heng
Shung Construction Co. Ltd., to undertake the
Environmental Team (ET) services to carry out environmental monitoring and
audit (EM&A) for both pre-construction and construction phases of the
Proposed Comprehensive Development at Wo Shang Wai, Yuen Long. From August 2016,
the Project Proponent, Profit Point Enterprises Limited, commissioned MMHK to
continue the ET services.
According
to the EP Condition 4.5, the monthly EM&A Report shall be submitted to the
Director within two weeks after the end of the reporting month. This report
summarises the findings during the period from 1 to 31 May 2019.
1.2 Project Organization
The organisation chart and lines of
communication with respect to the on-site environmental management structure
together with the contact information of the key personnel are shown in Appendix A.
1.3 Environmental Status in the
reporting period
During the
reporting month, construction works of the Project undertaken include:
● General site maintenance work
● Regular maintenance work for the
Wetland Restoration Area (including lowering of the water level and removal of
unwanted species in the pond)
There were
no major construction works carried out. The general layout plan of the Project
site is shown in Figure 1.1.
1.4 Summary of EM&A Requirements
The
EM&A programme requires environmental monitoring of air quality, noise,
water quality, ecology and landscape and visual as specified in the approved
EM&A Manual.
A summary
of impact EM&A requirements is presented in Table
1.1 below:
Table 1.1: Summary of Impact
EM&A Requirements
|
Parameters |
Descriptions |
Locations |
Frequencies |
|
Air
Quality |
24-Hour
TSP |
ASR1,
ASR2A, ASR3, ASR4 |
Once every
6 days |
|
1-Hour
TSP |
ASR1,
ASR2A, ASR3, ASR4 |
3
times every 6 days |
|
|
Noise |
Leq(30min),
L90, L10 (dB(A)) |
NSR1,
NSR3, NSR5, NSR7 |
Weekly |
|
Water
Quality |
Dissolved
Oxygen (DO), temperature, pH, suspended solids (SS) and Biochemical Oxygen
Demand (BOD) |
MP1 to
MP6 |
3
days per week |
|
Ecology |
Birds |
Within
the Project Area and Assessment Area of 500m |
Weekly |
|
Dragonflies
and Butterflies |
Within
the Project Area and Assessment Area of 500m |
Once
per month during Mar and Sep to Nov, and twice per month during Apr to Aug |
|
|
Herpetofauna |
Within
the Project Area and Assessment Area of 500m |
Day-time:
Once per month during Apr to Nov Night-time:
Once per month during Mar to Aug |
|
|
Water
quality of Wetland Restoration Area (WRA) |
WRA |
After
filling of WRA with water, monthly for in situ water quality and every six
months (end of wet season and end of dry season) for laboratory testing |
|
|
Site
Inspections |
Within
the Project Area and Assessment Area of 500m |
Weekly |
|
|
Landscape
and Visual |
Auditing
of protection of existing trees, the transplanting of existing trees, the
creation of new wetland, the planting of new trees and shrubs and other
landscape and visual mitigation measures |
CM1
to CM10 and OM1 to OM7 within the Project Area |
Site
inspections once every two weeks during construction phase; once every two
months during operational phase |
The
Environmental Quality Performance Limits for air quality, noise and water
quality are shown in Appendix C.
The Event
and Action Plan for air quality, noise, water quality and Landscape &
Visual are shown in Appendix D.
The
monitoring schedule for the reporting month is shown in Table
1.2 as follows.
Table
1.2: Environmental Monitoring and Audit Schedule for the Reporting Month

2 Impact Monitoring Methodology
2.1 Introduction
For air
quality, construction noise and water quality, ecology, landscape and visual
monitoring methodology, including the monitoring locations, monitoring
equipment used, monitoring parameters, and frequency and duration, etc., are
detailed in this Chapter.
2.2 Air Quality
2.2.1 Monitoring Parameters, Frequency and Duration
In
accordance with the EM&A Manual, 1-hour and 24-hour TSP levels monitoring
are to be conducted during the construction phase. Table
2.1 summarizes the monitoring parameters, frequency and duration of air
quality monitoring.
Table 2.1: Air Quality Monitoring
Parameters, Frequency and Duration
|
Monitoring
Stations |
Parameter |
Frequency
and Duration |
|
ASR1,
ASR2A, ASR3 & ASR4 |
24-hour
TSP |
At
least once in every six-days |
|
1-hour
TSP |
3
times every six-days |
2.2.2 Monitoring Locations
The four air
quality monitoring stations were established in the EM&A manual and were
slightly adjusted during the baseline monitoring phase. Locations of the agreed
air quality monitoring stations are listed in Table 2.2
and as shown in Figure 2.1.
Table 2.2: Air Monitoring Stations
|
Monitoring
Stations |
Locations |
|
ASR1 |
Guard
house outside House No. 1, Ventura Avenue, Royal Palms* |
|
ASR2A |
At
the rooftop of refuse collection point, which is located at the southwest of
the project area |
|
ASR3 |
At
the commercial centre at Palm Springs, which is located at the south of the
project area |
|
ASR4 |
Outside
works site entrance* |
*Note:
Relocation of ASR1 and ASR4 were from 5 June 2018 as the previous locations will
be subject to upcoming construction works. All monitoring data at ASR1 and ASR4
from June 2018 is measured at the new monitoring locations.
2.2.3 Monitoring Equipment
Continuous 24-hour
TSP air quality monitoring is conducted using High Volume Sampler (HVS) (Model:
GMWS-2310 Accu-vol). The HVS meets all the
requirements of the EM&A Manual. Portable direct reading dust meters were
used to carry out the 1-hour TSP monitoring. Table 2.3 summarizes the equipment used in
the impact air quality monitoring.
Table 2.3: TSP Monitoring Equipment
|
Equipment |
Model |
|
24-hr TSP monitoring |
|
|
High
Volume Sampler |
GMWS
2310 Accu-vol |
|
Calibrator |
GMW
25 |
|
1-hr TSP monitoring |
|
|
Portable
direct reading dust meter |
AM510
SidePak Personal Aerosol Monitor |
2.2.4 Monitoring Methodology
2.2.4.1
24-hour TSP Monitoring
Installation
The HVS was
installed in the vicinity of the air sensitive
receiver. The following criteria were considered in the installation of
the HVS.
● A horizontal platform with
appropriate support to secure the sampler against gusty wind was provided.
● The distance between the HVS and any
obstacles, such as buildings, was at least twice the height that the obstacle
protrudes above the HVS.
● A minimum of two metres separation
from walls, parapets and penthouse was required for rooftop sampler.
● A minimum of two metres separation
from any supporting structure, measured horizontally was required.
● No furnace or incinerator flues or
building vent were nearby.
● Airflow around the sampler was
unrestricted.
● The sampler has been more than 20
metres from any drip line.
● Permission was obtained to set up
the samplers and to obtain access to the monitoring stations.
● A secured supply of electricity is
needed to operate the samplers.
Preparation
of Filter Papers
● Glass fibre filters were labelled
and sufficient filters that were clean and without
pinholes were selected.
● All filters were equilibrated in the
conditioning environment for 24 hours before weighing. The conditioning
environment temperature was around 25 °C and not variable by more than ±3 °C
with relative humidity (RH) < 50% and was not variable by more than
±5%. A convenient working RH was 40%.
Field
Monitoring
● The power supply was checked to
ensure the HVS works properly.
● The filter holder and the area
surrounding the filter were cleaned.
● The filter holder was removed by
loosening the four bolts and a new filter, with stamped number upward, on a
supporting screen was aligned carefully.
● The filter was properly aligned on
the screen so that the gasket formed an airtight seal on the outer edges of the
filter.
● The swing bolts were fastened to
hold the filter holder down to the frame. The pressure applied should be sufficient to avoid air leakage at the edges.
● The shelter lid was closed and was
secured with the aluminium strip.
● The HVS was warmed-up for about 5
minutes to establish run-temperature conditions.
● A new flow rate record sheet was set
into the flow recorder.
● The flow rate of the HVS was checked
and adjusted at around 1.1 m3/min. The range specified in the EM&A
Manual was between 0.6-1.7 m3/min.
● The programmable timer was set for a
sampling period of 24 hrs + 1 hr, and the starting time, weather condition and
the filter number were recorded.
● The initial elapsed time was
recorded.
● At the end of sampling, the sampled
filter was removed carefully and folded in half-length so that only surfaces
with collected particulate matter were in contact.
● It was then placed in a clean
plastic envelope and sealed.
● All monitoring information was
recorded on a standard data sheet.
● Filters were sent to a HOKLAS
accredited laboratory for analysis.
Maintenance
and Calibration
● The HVS and its accessories are
maintained in good working condition, such as replacing motor brushes routinely
and checking electrical wiring to ensure a continuous power supply.
● HVSs were calibrated at two-month
intervals.
● Calibration records for HVSs are
shown in Appendix E.
2.2.4.2
1-hour TSP Monitoring
Field
Monitoring
The
measuring procedures of the 1-hour dust meter are in accordance with the
Manufacturer’s Instruction Manual as follows:
● Set POWER to “ON”, push BATTERY
button, make sure that the meter’s indicator is in the range with a red line
and allow the instrument to stand for about 3 minutes (Then, the air sampling
inlet has been capped).
● Push the knob at MEASURE position.
● Push “O-ADJ” button. (Then meter’s
indication is 0).
● Push the knob at SENSI ADJ position and
set the meter’s indication to S value described on the Test Report using the
trimmer for SENSI ADJ.
● Pull out the knob and return it to
MEASURE position.
● Push “START” button.
Maintenance
and Calibration
● The 1-hour dust meter would be checked
at 3-month intervals and calibrated at 1-year intervals throughout all stages
of the air quality monitoring.
● Calibration records for direct dust
meters are shown in Appendix E.
2.3 Construction Noise
2.3.1 Monitoring Parameters, Frequency and Duration
Following
the requirements in the EM&A Manual for noise, noise monitoring has to be carried out during the construction phase.
Continuous noise monitoring for the A-weighted levels Leq(30 min),
L10 and L90 is undertaken once per every week.
Table 2.4 summarizes the monitoring parameters, frequency and duration of air
quality monitoring.
Table 2.4: Noise Monitoring
Parameters, Frequency and Duration
|
Monitoring
Stations |
Parameter |
Frequency
and Duration |
|
NSR1,
NSR3, NSR5, NSR7 |
Leq(30min),
L90, L10 (dB(A)) |
Once
every week |
2.3.2 Monitoring Locations
The four
noise quality monitoring stations were established in the EM&A manual and were
slightly adjusted during the baseline monitoring phase. Locations of the agreed
noise quality monitoring stations are listed in Table
2.5 and as shown in Figure 2.2.
Table 2.5: Noise Monitoring Stations
|
Monitoring
Stations |
Locations |
Type
of measurement |
|
NSR1 |
Noise
monitoring equipment was set up near the boundary wall at Palm Springs. |
Free-field |
|
NSR3 |
The
monitoring station was located next to the guard house at Palm Springs. |
Facade |
|
NSR5 |
Outside
House No. 1, Ventura Avenue, Royal Palms* |
Facade |
|
NSR7 |
The
monitoring station was located near the boundary wall of the house of Mai Po
San Tsuen. |
Free-field
|
*Note:
Relocation of NSR5 was from 5 June 2018 as the previous location will be
subject to upcoming construction works. All monitoring data at NSR5 from June
2018 is measured at the new monitoring location.
2.3.3 Monitoring Equipment
Integrating Sound Level Meter will be used for noise monitoring. It is a
Type 1 sound level meter capable of giving a continuous readout of the noise
level readings including equivalent continuous sound pressure level (Leq) and percentile sound pressure level (Lx).
They comply with International Electrotechnical Commission Publications
651:1979 (Type 1) and 804:1985 (Type 1). Table 2.6
summarizes the noise monitoring equipment model being used.
Table 2.6: Noise Monitoring
Equipment
|
Equipment
|
Model |
|
Integrating
Sound Level Meter |
Rion
NL-52 |
|
Calibrator |
Casella
CEL-120/1 |
2.3.4 Monitoring Methodology
Field
Monitoring
● The Sound Level Meter was set on a
tripod at a height of at least 1.2 m above the ground.
● Façade and free-field measurements
were made at the monitoring locations.
● The battery condition was checked to
ensure the correct functioning of the meter.
● Parameters such as frequency
weighting, the time weighting and the measurement time were set as follows:
– frequency weighting: A
– time weighting: Fast
– time measurement: 30 minutes
intervals (between 07:00 and 19:00)
● Prior to and after each noise
measurement, the meter was calibrated using a Calibrator for 94 dB at 1
kHz. If the difference in the calibration level before and after
measurement was more than 1 dB, the measurement would be considered invalid has
to be repeated after re-calibration or repair of the equipment.
● During the monitoring period, the Leq, L10 and L90 were
recorded. In addition, any site observations and noise sources were
recorded on a standard record sheet.
Maintenance
and Calibration
● The microphone head of the sound
level meter and calibrator is cleaned with soft cloth at quarterly intervals.
● The meter and calibrator are sent to
the supplier or HOKLAS laboratory to check and calibrate at yearly intervals.
● Calibration records are shown in Appendix E.
2.4 Water Quality
2.4.1 Monitoring Parameters, Frequency and Duration
In
accordance with the requirements in the EM&A Manual for water quality,
water quality parameters including Dissolved Oxygen (DO), temperature, pH,
turbidity, suspended solids (SS) and Biochemical Oxygen Demand (BOD) have to be monitored at designated monitoring stations
during construction of the Project. DO, temperature and pH were measured
in-situ whereas SS and BOD were analysed in a laboratory. The measurements
should be taken at all designated monitoring stations, three days per week. The
interval between any two sets of monitoring was not less than 36 hours. Table 2.7 summarizes the monitoring parameters,
frequency and duration of water quality monitoring.
Table 2.7: Water Quality Monitoring
Parameters, Frequency and Duration
|
Monitoring
Stations |
Parameter |
Frequency
and Duration |
|
MP1,
MP2, MP3, MP4, MP5 & MP6 |
DO,
temperature, pH, SS, turbidity, BOD |
Three
days every week |
2.4.2 Monitoring Locations
The six water
quality monitoring stations were established in the EM&A manual. Locations
of the agreed water quality monitoring stations are listed in Table 2.8 and as shown in Figure 2.3.
Table 2.8: Water Quality Monitoring
Stations
|
Monitoring
Stations |
Easting |
Northing |
|
MP1* |
838
730.50 |
822
862.25 |
|
MP2* |
838
933.26 |
823
247.41 |
|
MP3 |
839
107.17 |
823
596.84 |
|
MP4 |
839
286.14 |
823
638.55 |
|
MP5 |
839
134.35 |
823
722.99 |
|
MP6 |
839
063.02 |
823
842.25 |
*Note: The
water quality impact monitoring at MP1 and MP2 have been terminated since July
2012 due to withdrawal of access right from land owner.
2.4.3 Monitoring Equipment
The Water
Quality Monitoring Equipment and Analytical Methods applied to Water Quality Samples
are given in Table 2.9 and Table 2.10 respectively. Details of which are
discussed as follows.
Table 2.9: Water Quality Monitoring
Equipment
|
Equipment |
Model |
Equipment/Serial
Number |
|
Conductivity,
Dissolved oxygen, pH, Salinity and Temperature Measuring Meter, Turbidity |
YSI ProDss |
17E100747
|
|
Global
Positioning System (GPS) |
Garmin
eTrex Vista |
ENO
007 |
Table 2.10: Analytical Methods
applied to Water Quality Samples
|
Determinant,
unit |
Standard
Method |
|
Total
Suspended Solids, mg/L |
In
house method based on APHA 2540D; ALS Method Code: EA-025 |
|
Biochemical
Oxygen Demand (BOD), mg/L |
In
house method based on APHA 5210B; ALS Method Code: EP-030 |
All in-situ
monitoring instruments were checked, calibrated and certified by a laboratory
accredited under HOKLAS or any other international accreditation scheme before
use.
Dissolved
Oxygen (DO), Temperature, pH and Turbidity measuring equipment
A portable,
weatherproof multiparameter instrument (YSI Professional Plus) was used in the
monitoring. It can be capable for measuring dissolved oxygen (DO), temperature,
pH and turbidity simultaneously with the following limits:
● a dissolved oxygen level in the range
of 0-50 mg/L and 0-500 % saturation;
● a temperature of -5 to 70 degrees
Celsius;
● pH value of 0-14 with 0.1 as the
base unit; and
● turbidity between 0-4000 NTU
Global
Positioning System (GPS)
A hand-held
GPS navigator (Garmin eTrex Vista) was used to
identify the designated monitoring stations prior to water sampling.
Suspended
Solids and BOD Measurements (Sample Containers and Storage)
Water
samples for SS analysis were stored in high density polythene bottles with no
preservative added, packed in ice (cooled to 4 ºC without being frozen),
delivered to the laboratory, and analysed as soon as possible after collection.
Analysis was carried out in a HOKLAS accredited laboratory.
2.4.4 Detection Limit
The limits
of detection for the in-situ and laboratory measurements are shown in Table 2.11.
Table 2.11: Detection Limits for
Water Quality Determinants
|
Determinant |
Limit
of Detection |
|
Dissolved
Oxygen |
0.1
mg/L |
|
Temperature |
0.1
degree Celsius |
|
pH |
0.01
unit |
|
Turbidity |
0.1
NTU |
|
Suspended
Solids |
2
mg/L |
|
BOD |
2
mg/L |
2.4.5 Monitoring Methodology
In situ
Measurement
All pH
meters, DO/temperature meters had been checked and calibrated prior to use. Standard
buffer solution of at least two pH levels (either pH 4 and pH 7, or pH 7 and pH
10) had been used for calibration of the instrument before and after use.
DO meters
had been calibrated by a laboratory accredited under HOKLAS or any other
international accreditation scheme, and subsequently re-calibrated at
three-monthly intervals throughout all stages of the water quality monitoring.
Responses of sensors and electrodes had been checked with certified standard
solutions before each use. Wet bulb calibrations for all DO meters had been
carried out before measurement at each monitoring location. For the on-site
calibration of field equipment, BS 127:1993, "Guide to field and on-site
test methods for the analysis of waters" had been observed.
Measurements
shall be at three water depths, namely, 1m below water surface, mid-depth and
1m above stream bed/pond bed, except where the water depth less that 6m, the
mid-depth station maybe omitted. Should the water depth be less than 3 m, only
the mid-depth station will be monitored.
Replicates
in-situ measurements and samples collected from each independent monitoring
event are required for all parameters to ensure a robust statistically
interpretable dataset.
Water
Samples Preparation and Analysis
For
collection of water sampling within the water courses, a 500ml clean plastic
beaker was used. After collection, the water samples were stored in
high-density polythene bottles. The sample container was rinsed with a portion
of the water sample. The water sample was then transferred to the container,
labelled with a unique sample ID and sealed with a screw cap. The water samples
were stored in a cool box maintained at 4 ºC. The water samples were then
delivered to a local HOKLAS-accredited laboratory (ALS) on the same day for
analysis.
The testing
methods of testing parameters as recommended by EIA or required by EPD, with
the QA/QC results are in accordance with the requirement of HOKLAS or
international accredited scheme.
The
calibration certificates for equipment used for in-situ monitoring of water
quality are attached in Appendix E.
2.5 Ecology
2.5.1 Monitoring Parameters, Frequency and Duration
Target species
and certain other fauna will be monitored within the Project Area and
Assessment Area during the wetland and residential construction phase. This
will be important to ensure that any unexpected events or impacts either on- or
off-site are quickly identified so that remedial action can be taken. The
groups to be monitored and frequency of monitoring are shown in Table 2.12.
Table 2.12: Summary of Construction
Phase Ecological Monitoring for the Wo Shang Wai Wetland Restoration Area (WRA)
|
Species
/ Parameter |
Construction
Phase Ecological Monitoring |
|
Birds |
Weekly
(including Assessment Area). |
|
Dragonflies
and Butterflies |
Once
per month during March and September to November; and twice per month during
April to August. |
|
Herpetofauna |
Day-time:
Once per month during April to November; and Night-time:
Once per month during March to August |
|
Water
Quality |
After
filling of WRA with water, monthly for in situ water quality and every six months
(end of the wet season and end of the dry season) for laboratory testing. |
|
Site
Inspections |
Weekly. |
2.5.2 Monitoring Locations and Methodology
Ecological
monitoring locations during construction phase are shown in Figure 4.1 and the methodology for
ecological monitoring is detailed in Section 4.
2.6 Landscape and Visual
2.6.1 Monitoring Parameters, Frequency and Duration
All
measures undertaken by both the Contractor and the specialist Landscape
Sub-Contractor during the construction phase and first year of the operational
phase shall be audited by a Registered Landscape Architect, as a member of the
ET, on a regular basis to ensure compliance with the intended aims of the
measures. Site inspections should be undertaken at least once every two
weeks throughout the construction period and once every two months during the
operational phase.
The broad
scope of audit is detailed below but should also be undertaken with reference
to the more specific checklist provided in Table 2.13
below. Operational phase auditing will be restricted to the last 12 months of
the establishment works of the landscaping proposals and thus only the items
below concerning this period are relevant to the operational phase.
● The extent of the agreed works area
should be regularly checked during the construction phase. Any trespass by the
Contractor outside the limit of the works, including any damage to existing
trees and woodland shall be noted;
● The progress of the engineering
works should be regularly reviewed on site to identify the earliest practical
opportunities for the landscape works to be undertaken;
● All existing vegetation, streams and
other features within the study area which are not directly affected by the
works are retained and protected;
● The methods of protecting existing
vegetation proposed by the Contractor are acceptable and enforced;
● Preparation, lifting transport and
re-planting operations for any transplanted trees;
● The layout, design and construction
of buildings conforms to requirements specified in the EIA report;
● All landscaping works are carried
out in accordance with the EIA recommendations and with specifications;
● The planting of new trees, shrubs,
groundcover, climbers, grasses and other plans, together with the replanting of
any transplanted trees are carried out properly and within the right season;
● All necessary horticultural operations
and replacement planting are undertaken throughout the Establishment Period to
ensure the healthy establishment and growth of both transplanted trees and all
newly establishment plants.
Table 2.13: Construction and
Operation Phase Audit Checklist
|
Area
of Works |
Items
to be Monitored |
|
Works
Area |
Check
the extent of the Works to ensure that the Works Area is not exceeded the
site boundaries. |
|
Protection
of all trees and woodland blocks to be retained |
Identification
and demarcation of trees / vegetation to be retained, erection of physical
protection (e.g. fencing), monitoring against possible incursion, physical
damage, fire, pollution, surface erosion, etc. |
|
Streams |
Ensure
no run-off into existing streams |
|
Clearance
of existing vegetation |
Identification
and demarcation of trees / vegetation to be cleared, checking of extent of
works to minimize damage, monitoring of adjacent areas against possible
incursion, physical damage, fire, pollution, surface erosion, etc. |
|
Transplanting
of trees |
Identification
and demarcation of trees / vegetation to be transplanted, monitoring of
extent of pruning / lifting works to minimize damage, timing of operations
implementation of all stages of preparatory and translocation works, and maintenance
of transplanted vegetation, etc. |
|
Topsoil
stripping |
Ensuring
existing topsoil is stripped and stored under recognized good practice and is
hydroseeded and regularly turned to prevent anaerobic conditions |
|
New
buildings |
Ensure
that building finishes accord with mitigation proposals with
regard to colour and albedo. |
|
Boundaries |
Ensuring
hoarding are erected as required |
|
Noise
Barrier |
Ensure
noise barrier design accords with the mitigation proposals with
regard to location, materials and finishes. |
|
Night-time
lighting |
Ensuring
night-time lighting is directional, hooded and shielded away from VSRs |
|
Plant
supply |
Monitoring
of operations relating to the supply of specialist plant material (including
the collecting, germination and growth of plants from seed) to ensure that
plants will be available in time to be used within the construction works. |
|
Landscape
and wetland treatments generally |
Check
that wetland, and hard / soft landscape designs conform to intent of
mitigation measures and agreed designs |
|
Soiling,
planting, etc. |
Monitoring
of implementation and maintenance of soiling and planting works against
possible incursion, physical damage, fire, pollution, surface erosion, etc. |
|
Establishment
Works |
Monitoring
of implementation of maintenance operation during Establishment Period |
2.6.2 Monitoring Locations
The
monitoring locations should check against the mitigation measures proposed
under the approved Environmental Impact Assessment, which are summarised as
follows in Table 2.14 and Table 2.15:
Table 2.14: Proposed Construction
Phase Mitigation Measures
|
ID
No. |
Landscape
and Visual Mitigation Measures |
|
CM1 |
The construction
area and contractor’s temporary works areas should be minimised to avoid
impacts on adjacent landscape. |
|
CM2 |
Screening
of construction works by hoardings/noise barriers around Works area in
visually unobtrusive colours, to screen Works. |
|
CM3 |
Reduction
of construction period to practical minimum. |
|
CM4 |
Topsoil,
where identified, should be stripped and stored for re-use in the
construction of the soft landscape works, where the soil material meets
acceptable criteria and where practical. The Contract Specification
shall include storage and reuse of topsoil as appropriate. |
|
CM5 |
Hydroseeding
or sheeting of soil stockpiles with visually unobtrusive material (in earth
tone). |
|
CM6 |
Advance
screen planting to noise barriers. |
|
CM7 |
Control
night-time lighting and glare by hooding all lights. |
|
CM8 |
Ensure
no run-off into streams adjacent to Project Area. |
|
CM9 |
Protection
of existing trees on boundary of project area shall be carefully protected
during construction. Detailed Tree Protection Specification shall be
provided in the Contract Specification. Under this specification, the
Contractor shall be required to submit, for approval, a detailed working
method statement for the protection of trees prior to undertaking any works
adjacent to all retained trees, including trees in contractor’s works
areas. (Tree protection measures will be detailed at S16 and Tree
Removal Application stage). |
|
CM10 |
Trees
unavoidably affected by the works shall be transplanted where
practical. Trees should be transplanted straight to their destinations
and not held in a nursery. A detailed Tree Transplanting Specification
shall be provided in the Contract Specification, if applicable. Sufficient time for necessary tree root and crown
preparation periods shall be allowed in the project programme. |
Table 2.15: Proposed Operation Phase
Mitigation Measures
|
ID
No. |
Landscape
Mitigation Measures |
|
OM1 |
Compensatory
Tree Planting for all felled trees shall be provided to the satisfaction of
relevant Government departments. Required numbers and locations of
compensatory trees shall be determined and agreed separately with Government
during the Tree Felling Application process under ETWBTC 3/2006. |
|
OM2 |
A continuous
belt of screen planting along southern perimeter of project area with fast
growing tree species. At least 450 trees capable of reaching a height
> 10m within 10 years should be planted. Planting of the belt of
trees shall be carried out as advance works ahead of other site formation and
building works. |
|
OM3 |
Maximise
soft landscape and amenity water bodies in residential areas of the
development. Approximately 750 trees (of Heavy Standard size) should be
planted. Where space permits, roadside berms should be created. Street
trees should be of species that reach a mature height of no less than 15m. |
|
OM4 |
Maximise
freshwater habitat wetland creation consistent with achieving other
parameters. Minimum 4.74 ha to be provided. Wetlands must have natural
edge profiles with >1m wide emergent zone. No access to the wetland
by residents and all wetlands must be screened from residential development
by a continuous tree screen at interface with residential development or
earth mounding such that disturbance is minimised. Implementation of the
wetland shall be carried out as advance works. |
|
OM5 |
Use
appropriate (visually unobtrusive and non-reflective) building materials and
colours in built structures. |
|
OM6 |
During
detailed design, refine building layout to create a min. 10m wide gap between
buildings north of Wo Shang Wai pond and also two
min. 10m wide gaps in the row of buildings adjacent to Royal Palms. |
|
OM7 |
Streetscape
elements (e.g. paving, signage, street furniture, lighting etc.) shall be
sensitively designed in a manner that responds to the local context and
minimises potential negative landscape and visual impacts. Lighting
units should be directional and minimise unnecessary light spill. |
3 Monitoring
Results
|
3.1 Impact Monitoring Schedule
Impact
monitoring for air quality (dust), noise and water quality due to the
construction work were undertaken during the reporting month in compliance with
the EM&A manual in the reporting period. Regular site inspections were carried
out on 2, 9, 16, 23 and 29 May 2019 during the reporting month to assess the
compliance with environmental requirements.
3.2 Results of Impact Monitoring
3.2.1 Air Quality Monitoring
3.2.1.1
1-hour TSP
Results of
1-hour TSP at the four monitoring locations are summarised in Table 3.1. Graphical plots of the monitoring
results are shown in Appendix F. The
weather conditions in the reporting period are provided in Appendix G.
Table 3.1: Summary of 1-hour TSP
Monitoring Results
|
Monitoring
Date |
Start
Time |
1-hr
TSP (mg/m3) |
Range
(mg/m3) |
Action
Level (mg/m3) |
Limit
Level (mg/m3) |
||
|
1st Result |
2nd Result |
3rd Result |
|||||
|
ASR1 |
|
|
|
|
|
|
|
|
3-May-19 |
8:51 |
70 |
78 |
54 |
18-78 |
378 |
500 |
|
9-May-19 |
8:52 |
20 |
26 |
28 |
|||
|
15-May-19 |
9:00 |
25 |
20 |
18 |
|||
|
18-May-19 |
9:00 |
30 |
29 |
27 |
|||
|
24-May-19 |
8:59 |
47 |
41 |
44 |
|||
|
30-May-19 |
8:55 |
36 |
31 |
35 |
|
|
|
|
ASR2A |
|
|
|
|
|
|
|
|
3-May-19 |
12:55 |
74 |
64 |
66 |
19-74 |
357 |
500 |
|
9-May-19 |
13:00 |
26 |
32 |
36 |
|||
|
15-May-19 |
13:07 |
23 |
25 |
19 |
|||
|
18-May-19 |
13:03 |
34 |
31 |
34 |
|||
|
24-May-19 |
13:00 |
36 |
36 |
31 |
|||
|
30-May-19 |
12:55 |
33 |
23 |
23 |
|
|
|
|
ASR3 |
|
|
|
|
|
|
|
|
3-May-19 |
12:43 |
66 |
63 |
62 |
19-66 |
358 |
500 |
|
9-May-19 |
12:50 |
19 |
23 |
26 |
|||
|
15-May-19 |
12:55 |
20 |
25 |
23 |
|||
|
18-May-19 |
12:52 |
31 |
29 |
28 |
|||
|
24-May-19 |
12:48 |
29 |
28 |
29 |
|||
|
30-May-19 |
12:44 |
32 |
25 |
23 |
|
|
|
|
Monitoring
Date |
Start
Time |
1-hr
TSP (mg/m3) |
Range
(mg/m3) |
Action
Level (mg/m3) |
Limit
Level (mg/m3) |
||
|
1st Result |
2nd Result |
3rd Result |
|||||
|
ASR4 |
|
|
|
|
|
|
|
|
3-May-19 |
9:06 |
67 |
65 |
58 |
18-67 |
372 |
500 |
|
9-May-19 |
9:05 |
18 |
24 |
28 |
|||
|
15-May-19 |
9:11 |
19 |
21 |
20 |
|||
|
18-May-19 |
9:13 |
28 |
28 |
26 |
|||
|
24-May-19 |
9:14 |
36 |
30 |
28 |
|||
|
30-May-19 |
9:10 |
37 |
37 |
35 |
|
|
|
3.2.1.2
24-hour TSP
Results of
24-hour TSP at the four monitoring locations are summarised in Table 3.2. Graphical plots of the monitoring
results are shown in Appendix F. The
weather conditions in the reporting period are provided in Appendix G.
Table 3.2: Summary of 24-hour TSP
Monitoring Results
|
Monitoring
Date |
Monitoring
Results (mg/m3) |
Range
(mg/m3) |
Action
Level (mg/m3) |
Limit
Level (mg/m3) |
|
ASR1 |
|
|
|
|
|
3-May-19 |
79 |
38-79 |
226 |
260 |
|
9-May-19 |
49 |
|||
|
15-May-19 |
38 |
|||
|
18-May-19 |
38 |
|||
|
24-May-19 |
52 |
|||
|
30-May-19 |
57 |
|
|
|
|
ASR2A |
|
|
|
|
|
3-May-19 |
79 |
37-79 |
213 |
260 |
|
9-May-19 |
56 |
|||
|
15-May-19 |
37 |
|||
|
18-May-19 |
51 |
|||
|
24-May-19 |
61 |
|||
|
30-May-19 |
50 |
|
|
|
|
ASR3 |
|
|
|
|
|
3-May-19 |
77 |
38-77 |
205 |
260 |
|
9-May-19 |
53 |
|||
|
15-May-19 |
38 |
|||
|
18-May-19 |
40 |
|||
|
24-May-19 |
48 |
|||
|
30-May-19 |
47 |
|
|
|
|
ASR4 |
|
|
|
|
|
3-May-19 |
81 |
35-81 |
237 |
260 |
|
9-May-19 |
54 |
|||
|
15-May-19 |
35 |
|||
|
18-May-19 |
39 |
|||
|
24-May-19 |
59 |
|||
|
30-May-19 |
55 |
|
|
|
No
exceedance of 1-hour and 24-hour TSP (Action or Limit Level) was recorded in
the reporting period.
3.2.2 Construction Noise Monitoring
The
construction noise monitoring results are summarized in Table
3.3. Graphical plots of the monitoring data are shown in Appendix F. The weather conditions in
the reporting period are provided in Appendix
G.
Table 3.3: Summary of Construction
Noise Monitoring Results
|
Monitoring
Date |
Start
Time |
Mean
and Range of Noise Levels, dB(A) |
Limit
Level for Leq (dB(A)) |
||
|
Leq |
L10 |
L90 |
|||
|
NSR1 |
|
|
|
|
|
|
3-May-19 |
11:17 |
53 |
56 |
43 |
75 |
|
9-May-19 |
11:14 |
51 |
52 |
42 |
|
|
15-May-19 |
11:13 |
53 |
56 |
45 |
|
|
24-May-19 |
11:22 |
55 |
56 |
47 |
|
|
30-May-19 |
11:29 |
53 |
56 |
48 |
|
|
NSR3 |
|
|
|
|
|
|
3-May-19 |
10:38 |
55 |
56 |
44 |
75 |
|
9-May-19 |
10:33 |
49 |
51 |
43 |
|
|
15-May-19 |
10:32 |
51 |
53 |
45 |
|
|
24-May-19 |
10:41 |
51 |
54 |
47 |
|
|
30-May-19 |
10:49 |
51 |
52 |
46 |
|
|
NSR5 |
|
|
|
|
|
|
3-May-19 |
9:53 |
50 |
51 |
47 |
75 |
|
9-May-19 |
9:50 |
52 |
54 |
46 |
|
|
15-May-19 |
9:51 |
53 |
56 |
48 |
|
|
24-May-19 |
10:00 |
53 |
56 |
46 |
|
|
30-May-19 |
9:57 |
52 |
56 |
48 |
|
|
NSR7 |
|
|
|
|
|
|
3-May-19 |
9:12 |
67 |
68 |
64 |
75 |
|
9-May-19 |
9:09 |
67 |
68 |
65 |
|
|
15-May-19 |
9:12 |
65 |
66 |
63 |
|
|
24-May-19 |
9:20 |
65 |
67 |
63 |
|
|
30-May-19 |
9:16 |
65 |
67 |
63 |
|
No exceedance
(Action/Limit Level) of construction noise was recorded in the reporting
period.
3.2.3 Water Quality Monitoring
The water
quality monitoring results are summarized in Table 3.4.
Graphical plots of the monitoring data are shown in Appendix F. The weather conditions in
the reporting period are provided in Appendix
G.
Table 3.4: Summary of Water Quality
Monitoring Results
|
Monitoring
Date |
Temp
(ºC) |
pH |
Dissolved
Oxygen (DO) (mg/L) |
DO
(%) |
Turbidity
(NTU) |
BOD
(mg/L)(1) |
Suspended
Solids (mg/L) |
|
MP3 |
|
|
|
|
|
|
|
|
5/2/2019 |
24.8 |
7.3 |
7.9 |
96.4 |
46.6 |
8.0 |
46.5 |
|
5/4/2019 |
24.4 |
7.2 |
7.8 |
94.2 |
35.9 |
4.5 |
36.0 |
|
5/6/2019 |
23 |
7.3 |
8 |
92.8 |
15.8 |
5.0 |
15.5 |
|
5/8/2019 |
22.2 |
7.2 |
8.5 |
96.7 |
29.8 |
5.0 |
30.0 |
|
5/10/2019 |
26.4 |
7.2 |
8 |
99.6 |
10.5 |
4.0 |
9.5 |
|
5/14/2019 |
32.2 |
7.2 |
7.3 |
104.8 |
23.3 |
16.0 |
23.0 |
|
5/16/2019 |
31 |
7.2 |
7.4 |
105.0 |
46.7 |
13.5 |
46.5 |
|
5/18/2019 |
29.6 |
7.3 |
7.2 |
100.9 |
35.7 |
2.0 |
35.5 |
|
5/20/2019 |
31 |
7.2 |
7.4 |
100.1 |
26.4 |
19.0 |
26.5 |
|
5/22/2019 |
26 |
7.2 |
7.5 |
93.1 |
29.9 |
14.0 |
30.0 |
|
5/24/2019 |
24.6 |
7.3 |
8 |
96.0 |
11.3 |
4.0 |
11.0 |
|
5/27/2019 |
26 |
7.3 |
8 |
97.3 |
12.4 |
7.5 |
13.0 |
|
5/29/2019 |
25.6 |
7.3 |
7.7 |
101.2 |
31.3 |
7.5 |
32.0 |
|
5/31/2019 |
27 |
7.3 |
7.6 |
96.3 |
19.7 |
7.0 |
20.5 |
|
Action
Level |
- |
<5.5
or >7.5 |
<6.85 |
- |
>64 |
- |
>65 |
|
Limit
Level |
- |
<4.0
or >8.0 |
<6.65 |
- |
>67 |
- |
>66 |
|
|
|
|
|
|
|
|
|
|
MP4 |
|
|
|
|
|
|
|
|
5/2/2019 |
24.3 |
7.1 |
6.7 |
76.9 |
33.2 |
3.5 |
33.0 |
|
5/4/2019 |
23.9 |
6.9 |
7.1 |
83.3 |
37.6 |
2.0 |
38.0 |
|
5/6/2019 |
22.5 |
7.2 |
7.1 |
77.8 |
37.5 |
2.0 |
37.0 |
|
5/8/2019 |
21.7 |
7.0 |
7.0 |
71.2 |
28.1 |
2.0 |
27.5 |
|
5/10/2019 |
25.9 |
7.0 |
7.2 |
88.4 |
41.7 |
2.0 |
42.0 |
|
5/14/2019 |
31.7 |
7.1 |
6.7 |
78.9 |
18.7 |
3.0 |
19.0 |
|
5/16/2019 |
30.5 |
6.8 |
6.6 |
77.0 |
35.3 |
3.5 |
35.0 |
|
5/18/2019 |
29.1 |
7.1 |
6.6 |
70.1 |
56.8 |
3.5 |
58.5 |
|
5/20/2019 |
30.5 |
6.8 |
6.6 |
77.8 |
49.5 |
6.5 |
49.5 |
|
5/22/2019 |
25.5 |
7.0 |
7.0 |
82.1 |
35.8 |
7.5 |
35.0 |
|
5/24/2019 |
24.1 |
7.1 |
7.0 |
77.3 |
21.0 |
2.0 |
21.0 |
|
5/27/2019 |
25.5 |
7.2 |
7.1 |
73.8 |
23.3 |
3.5 |
24.5 |
|
5/29/2019 |
25.1 |
7.0 |
6.8 |
77.8 |
12.2 |
3.5 |
12.5 |
|
5/31/2019 |
26.5 |
6.9 |
6.8 |
81.4 |
36.7 |
2.5 |
36.5 |
|
Action
Level |
- |
<5.5
or >7.5 |
<3.91 |
- |
>60 |
- |
>50 |
|
Limit
Level |
- |
<4.0
or >8.0 |
<3.82 |
- |
>64 |
- |
>53 |
|
|
|
|
|
|
|
|
|
|
MP5 |
|
|
|
|
|
|
|
|
5/2/2019 |
26.0 |
7.4 |
7.1 |
82.8 |
38.7 |
6.0 |
38.5 |
|
5/4/2019 |
25.6 |
7.4 |
7.0 |
86.0 |
35.2 |
<2 |
35.0 |
|
5/6/2019 |
24.2 |
7.5 |
6.9 |
77.5 |
25.8 |
4.5 |
25.5 |
|
5/8/2019 |
23.4 |
7.4 |
6.8 |
78.0 |
30.9 |
3.5 |
30.5 |
|
5/10/2019 |
27.6 |
7.3 |
7.3 |
92.7 |
35.7 |
3.0 |
35.5 |
|
5/14/2019 |
33.4 |
7.3 |
6.8 |
79.7 |
39.8 |
7.0 |
39.5 |
|
5/16/2019 |
32.2 |
7.4 |
6.7 |
79.4 |
33.9 |
5.0 |
33.5 |
|
5/18/2019 |
30.8 |
7.4 |
6.5 |
66.6 |
48.0 |
8.0 |
49.5 |
|
5/20/2019 |
32.2 |
7.3 |
6.8 |
76.9 |
39.1 |
16.0 |
38.5 |
|
5/22/2019 |
27.2 |
7.3 |
6.9 |
79.9 |
24.2 |
4.5 |
24.0 |
|
5/24/2019 |
25.8 |
7.3 |
6.8 |
73.4 |
13.3 |
4.0 |
12.5 |
|
5/27/2019 |
27.2 |
7.4 |
6.8 |
72.5 |
37.8 |
6.0 |
41.5 |
|
5/29/2019 |
26.8 |
7.4 |
7.0 |
80.8 |
17.6 |
3.5 |
18.0 |
|
5/31/2019 |
28.2 |
7.3 |
6.6 |
78.4 |
48.7 |
5.0 |
48.5 |
|
Action
Level |
- |
<5.5
or >7.5 |
<4.13 |
- |
>81 |
- |
>66 |
|
Limit
Level |
- |
<4.0
or >8.0 |
<3.87 |
- |
>84 |
- |
>69 |
|
|
|
|
|
|
|
|
|
|
MP6 |
|
|
|
|
|
|
|
|
5/2/2019 |
26.1 |
7.5 |
6.7 |
78.2 |
40.1 |
6 |
39.5 |
|
5/4/2019 |
25.7 |
7.4 |
7.2 |
87.2 |
34.1 |
2 |
34 |
|
5/6/2019 |
24.3 |
7.5 |
6.9 |
78.5 |
29.9 |
4.5 |
30 |
|
5/8/2019 |
23.5 |
7.5 |
6.7 |
77.3 |
30.0 |
3.5 |
30 |
|
5/10/2019 |
27.7 |
7.4 |
7.1 |
90.4 |
40.5 |
3.5 |
40.5 |
|
5/14/2019 |
33.5 |
7.3 |
6.8 |
80.7 |
37.7 |
9.5 |
38 |
|
5/16/2019 |
32.3 |
7.4 |
6.7 |
77.6 |
49.0 |
6 |
49 |
|
5/18/2019 |
30.9 |
7.5 |
6.7 |
72.5 |
63.6 |
7.5 |
70 |
|
5/20/2019 |
32.3 |
7.4 |
7.0 |
71.7 |
48.9 |
9 |
50 |
|
5/22/2019 |
27.3 |
7.4 |
6.9 |
78.3 |
26.9 |
10 |
26.5 |
|
5/24/2019 |
25.9 |
7.3 |
6.9 |
72.7 |
18.8 |
4 |
19 |
|
5/27/2019 |
27.3 |
7.4 |
6.7 |
71.0 |
28.8 |
5.5 |
29 |
|
5/29/2019 |
26.9 |
7.4 |
6.7 |
77.5 |
19.3 |
4 |
18.5 |
|
5/31/2019 |
28.3 |
7.4 |
6.6 |
79.2 |
46.8 |
4.5 |
46.5 |
|
Action
Level |
- |
<5.5
or >7.5 |
<4.61 |
- |
>94 |
- |
>75 |
|
Limit
Level |
- |
<4.0
or >8.0 |
<4.52 |
- |
>96 |
- |
>75 |
Notes:
(1) “<2”: Value is too low to indicate
(<2mg/L).
(2)
Values in Bold
indicate Action Level exceedance.
(3)
Values Underlined
and in Bold indicate Limit Level exceedance.
3.2.3.1
Exceedance
Investigation and Findings
During May 2019, a total of one Limit
Level exceedances were observed. One Limit Level exceedance of SS was recorded
at MP4.
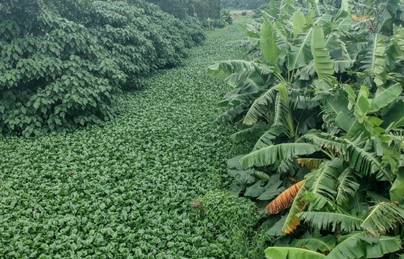
Exceedance of SS at MP4
Exceedance
of the Limit Level of SS was observed on 18 May 2019 at MP4.
It is noted
that the measured turbidity level at MP4 on the same day was high, although no
exceedance was recorded. It is believed that increased turbidity resulted in
higher SS inside the ditch water on the day of SS exceedance.
In
addition, on the day of SS exceedance, overgrown vegetation and a slightly
muddy appearance of the water body was observed at MP4. Appearance of the water
body at MP4 on 18 May 2019 is shown in the photo below.
Furthermore,
the SS levels recorded upstream at MP5 and MP6 on the same day were also
elevated but did not exceed the respective Action / Limit Levels.
As presented in the weekly site inspection checklists, no observation
regarding discharge of muddy water was recorded in May 2019. It is believed
that the discharged site effluent was not the cause of this SS exceedance. It
was probably due to localised natural variations instead.
Conclusion
As a result, the abovementioned exceedance(s) were unlikely to be due to
the project construction works and therefore not considered to be related to
the project.
4.1 Monitoring of Birds
This report
documents surveys conducted in the Survey Area between 1 and 31 May 2019. The
Wetland Restoration Area (WRA) is also surveyed as the area is accessible and
site formation works for WRA has been completed. The updated survey
transect is provided in Figure 4.1.
Dates and ecological surveys conducted during this period are summarised in Appendix H.
Monitoring
was undertaken following the survey methodology in the EM&A Manual. A transect
was followed in the bird surveys (see Figure
4.1). All bird species were identified to species and all bird species
of conservation importance and/or wetland dependent were enumerated and
recorded to the habitats in which they were observed. Flying birds were not
recorded unless they were foraging and/or associated with the habitat (such as
swifts). Further, notable bird observations during
other surveys were also recorded.
Bird
surveys were conducted on a weekly basis. A total of 28 bird species were
recorded in the Survey Area (excluding the WRA), 11 of which were species of
conservation importance and/or wetland-dependence. Within the WRA, 22 bird
species were recorded, 10 of which were species of conservation importance
and/or wetland-dependence including two of the three target species (Little
Egret and Chinese Pond Heron). The WRA continues to attract a
number of species of conservation importance, including Little Grebe, Tachybaptus ruficollis,
Great Egret, Ardea alba, Yellow Bittern,
Ixobrychus sinensis and
Black Kite, Milvus migrans. Little Grebe and
Yellow Bittern are listed by Fellowes et al. as of “Local Concern” in
2002. Great Egret is listed by Fellowes et al. as of “Potential Regional
Concern” in 2002. Black Kite is listed by Fellowes et al. as of
“Regional Concern” in 2002.
In addition
to wetland-dependence birds, the WRA also attracts a number
of terrestrial birds including Greater Coucal,
Centropus sinensis
which is listed as vulnerable (VU) in the China Red Data Book and is protected
under terrestrial wildlife state protection (category II). Survey findings
indicate that the WRA not only provides important habitat for
wetland-dependence birds but also the terrestrial birds.
A summary
of survey data is provided in Appendix I.
4.2 Monitoring of Herpetofauna
One
day-time and one night-time herpetofauna surveys were scheduled in the
reporting month. Further, notable herpetofauna observations during other surveys
were also recorded.
No
amphibian species nor reptile species were recorded in the Survey Area
(excluding the WRA) during the regular survey. One amphibian species and no
reptile species were recorded during the outside survey within the Survey Area
(excluding the WRA).
One
amphibian species and no reptile species were recorded within the WRA during
the regular survey. No amphibian species nor reptile species were recorded
during the outside survey within the WRA.
A summary
of the survey findings is provided in Appendix
J.
4.3 Monitoring of Dragonflies and
Butterflies
Two odonates and butterflies surveys were scheduled in the
reporting month. Further,
notable odonate and butterfly observations during
other surveys were recorded.
Five odonata species and three butterfly species were recorded
in the Survey Area (excluding the WRA) during the regular survey; while three odonata species and six butterfly species were recorded within
the WRA during the regular survey. Four odonata
species and two butterfly species were recorded in the Survey Area (excluding
the WRA) during the outside surveys; while four odonata
species and seven butterfly species were recorded within the WRA during the
outside surveys.
A summary
of the survey findings is provided in Appendix
J.
4.4 Monitoring of Mammals
Monitoring
of mammals was conducted concurrently with other surveys.
No mammal
species was recorded in the Survey Area (excluding the WRA) nor within the WRA
during the regular and outside surveys.
A summary
of the survey findings is provided in Appendix
J.
4.5 Monitoring of Water Quality
During the
reporting period, the water level of Cell 2, Cell 3 and Cell 4 reached the
action level on 14 May 2019 and 24 May 2019. The monitoring frequency will be
doubled in the coming month. According to the ecological monitoring data, the
low water level in the WRA attracted wetland dependence species including Little Grebe, Great Egret, Yellow Bittern, Black Kite,
White- breasted Waterhen, Common Moorhen, Common Sandpiper and Common
Kingfisher. As the low water level attracts wetland dependence birds,
the existing water level will be maintained as adaptive management.
Monitoring data
is presented in Appendix K. Locations for the
monitoring of water quality for the ecological monitoring are shown in Figure
4.2.
4.6 Management Activities
4.6.1 Vegetation Management
Removal
of exotic vegetation in all cells was undertaken; these removals included but were not limited to Ipomoea
sp., Mikania sp.,
Mimosa sp., Pennisetum sp. and Typha sp.
Vegetation
management activities undertaken at the site primarily involved watering of
plants, weeding and grass cutting.
4.6.2 Wildlife Management
Removal of
Golden Apple Snail was undertaken on an “as-seen” basis.
All sighted
Red Fire Ant nests were treated with approved pesticide.
Mitigation
actions have been taken in the WRA during the survey period to increase the WRA
utilization by birds, including:
1.
Controlling the
vegetation at Cell 1, Cell 2, Cell 3 and Cell 4; and
2.
Lowering the water
level of Cell 3 and Cell 4.
4.7 Summary
Ecological
monitoring during May 2019 was carried out according to the survey methodology
and frequency outlined in the EM&A Manual.
A summary
of the survey findings is listed in Table 4.1
below:
Table 4.1: Summary of Ecological
Monitoring in WRA and Survey Area under EM&A Manual
|
Species |
Survey Area (excluding WRA) |
WRA |
|
Birds
(total) |
28 |
22 |
|
Birds
(of conservation importance and/or wetland-dependence) |
11 |
10 |
|
Amphibians
|
1 |
1 |
|
Reptiles
|
0 |
0 |
|
Mammals |
0 |
0 |
|
Odonates
|
7 |
5 |
|
Butterflies
|
3 |
10 |
Survey
findings indicate that the ponds within the Survey Area supported numbers and
diversity of wetland-dependent birds typical of fish pond areas. The WRA continues
to attract wetland dependent fauna and serves as a buffer between the
residential portion and the fishponds in the north.
5.1 Site Inspections
The EM&A
programme for Landscape and Visual impact due to the construction commenced in
June 2010 and continued during the reporting period. Site inspections on
Landscape and Visual impact were carried out on 2, 16 and 29 May 2019 to
confirm the implementation of mitigation measures at the construction stage.
The Event
and Action Plan for Landscape & Visual is shown in Appendix D.
5.2 Construction Phase Audit Summary
The audit was
undertaken with references to the specific checklists provided in Table 2.13 – Table 2.15
and audit results are summarized below in Table 5.1.
Representative photos showing the implementation of mitigation measures are
presented in Appendix M.
Table 5.1: Construction and
Operation Phase Audit Summary
|
Area
of Works |
Items
of be Monitored |
|
Works
Area |
The
boundaries of the works area have been established on site in accordance with
the contract documents and approved plans (EP), and the limit of current
heavy construction activity is now confined to within the site hoardings
(North side of the site / access road) and the noise barriers (other sides of
the site). Minor works such as horticultural maintenance of the planting and
transplanted trees, and boundary fence repair was proceeding along the Royal
Palms – Palm Springs boundary. (Appendix
M Photo 1 – Table 2.14 CM2
refers) No
construction works were observed to have exceeded the site boundaries.
No construction was carried out at the wetland restoration area after 15
November 2010. |
|
Protection
of all trees and woodland blocks to be retained |
Trees
retained within the site along the northeast boundary, beside wetland
restoration area, have been identified and protected by temporary protective
fencing. |
|
Streams |
The works
site is partly encircled by a berm / perimeter channel to intercept surface
water and prevent it from washing off into any of the neighbouring
sites. Surface water is collected within the site in a temporary
drainage channel. Gravels beds and barriers have been installed to
filter site runoff, sedimentation ponds have been provided to enable primary
treatment before discharge to mains drains. |
|
Clearance
of existing vegetation |
Site
clearance was completed prior to the commencement of construction. |
|
Transplanting
of trees |
Tree
transplanting has been completed, with the trees relocated to various points
within the planting strip along the southern boundary of the site, outside
the noise barrier. Most of the trees continue to re-establish well up to
now, other than those (i.e. T597 and T35a) which were collapsed after Typhoon
Mangkhut. For these 2 nos. of transplanting trees,
tree removal work is completed, and tree replacement works should be
undertaken prior to other construction and building works. |
|
Topsoil
stripping |
Suitable
pond bund and soil material which had been excavated and stockpiled from the
original site, has now been re-used within the landscape works. Dust
suppression measures are active along all internal site access tracks. |
|
New buildings |
No
new permanent buildings have yet been constructed on site. |
|
Boundaries |
Hoardings
have been erected along most of the boundaries of the site.
Installation of new screen fence between the future residential sites and the
constructed wetland restoration areas is complete. Fence has been painted
green to match with the surrounding vegetated environment. (Appendix M Photo 1 – Table 2.14 CM2 refers) |
|
Noise
Barrier |
Noise
barriers have been installed along the southern and western boundaries of the
site in accordance with the contract requirements. Their design
complies with the mitigation requirements, with upper 6 to 7m portion of the
barrier being made from a translucent material with green tinted (to match
with the environment). Supporting GMS structure, likewise, has been painted
green. (Appendix M Photo 3
– Table 2.14 CM6 refers). |
|
Night-time
lighting |
No
night-time works were reported to have been carried out during the monitoring
period. |
|
Landscape
and wetland treatments generally |
Continuous
belt of screen planting along the southern and western boundaries of the site
has been completed. The formation, soiling and water control structures
of the wetland restoration area have been completed. (Appendix M Photo 3 – Table 2.14 CM6 refers) The
wetland areas are being established, with the ponds are being seasonally
filled with rain water. Planting of areas around the WRA cells is
complete. No construction was carried out at the wetland restoration
area after 15 November 2010. (Appendix M
Photo 2 – Table 2.14 CM2 refers) |
|
Soiling,
etc. |
The
soil placement and grading for each of the wetland restoration areas has been
completed. Refilling for those holes
left after the whole tree removal works has been completed. |
|
Plant
supply |
The
plant material used in the Advance Planting Strip and in the WRA are all
commonly available species and came from commercial sources. Transplanted
reeds (Phragmites australis) at the wetland habitat
came from the temporary holding nursery onsite. |
|
Planting |
The tree species are all from the
approved list. Some of the trees that were
identified having defects (i.e. broken branches, branch cracks, uprooted
roots, termite infestation and etc.), proper
mitigation measures are to be adopted. Some of the recently planted trees
are in poor condition. These trees are under close monitoring. If the
condition of these trees continues to deteriorate, tree replacement will be
required. Seedling trees and
shrubs have been established at the margins of the wetland cells. Some
invasive vegetation has been found during site inspection, removal of these
species should be undertaken on a regular basis. |
|
Establishment Works |
The
advance planting, the compensatory planting and transplanted trees are
generally being maintained by the landscape sub-contractor in accordance with
the specification to ensure that the contract requirements are met. Some
trees are in poor health condition. Close monitoring for those trees is
recommended. 4 nos. of trees were dead with
completely dehydrated tree crown and tree removal with replacement are
recommended. Regular
weeding for over-grown shrub is recommended. For those trees with trunk failure,
which may not be recovered, some of them were removed during the
arboricultural maintenance works. Tree removal works should be continued for
the trees with unrecoverable health and structure problems and subsequent
tree replacement is suggested. Regular
pruning of the trees should be undertaken to remove the defective parts (e.g.
dead branches, dieback, broken branches, hanging branches) on the trees. For
those uprooted /leaning trees, re-erection of these trees and installation of
proper tree support system are recommended. For those that might be
unrecoverable, tree removal and replacement are recommended. Termite
infestation was observed on numbers of trees. Proper treatment to remove
these termite tracks and termite nests should be undertaken immediately. For
those trees with severe termite infestation, application of approved
termiticide is recommended. Tree
stump removal is recommended after the tree removal so as
to make room for the new replacement trees. Tree
replacement works should be conducted as soon as possible prior to any other
site formation and building works. Removal
of extensive growth of weeds, unplanned tree seedlings, invasive climbers in
the space behind screen noise barrier needs to be undertaken on a monthly basis as they may inhibit the advance
planting. Horticultural
maintenance (grass cutting, weeding, watering etc.) in the shrubs and tree
seedling areas around the WRA cells should be undertaken regularly. Large
amount of ant nests was observed along the maintenance path of WRA area.
Pesticide should be applied to eradicate of all the nests to avoid further
spreading of ants. Regular
removal of invasive species (i.e. apple snails, Mikania micrantha, Mimosa pudica, Bidens alba and etc.) in WRA
should be undertaken. The growth of shrubs / seedlings on the north side of WRA remains
fair. |
6 Environmental
Site Inspection and Audit
|
6.1 Site Inspection
The ET had
carried out construction phase weekly site inspections on 2, 9, 16, 23 and 29 May
2019. All observations have been recorded in the site inspection checklist and
passed to the Contractor together with the appropriate recommended mitigation
measures where necessary. The key observations from site inspections and
associated recommendations are summarized in Table 6.1.
Table 6.1: Summary of Site
Inspections and Recommendations
|
Key
Observations |
ET
Recommendation |
Contractor’s
Responses / Action(s) Undertaken |
Close-out
(Date) |
|
General
refuse was observed being accumulated at ground. (16 May 2019) |
The
Contractor is advised to clear the refuse or provide proper treatment. |
Agreed
and followed-up |
23
May 2019 |
|
Overflow
of untreated water is observed at the interception barrier though the water
is visually clean. (29 May 2019) |
The
Contractor is advised to control the water flow to prevent the untreated
water at the discharge. |
Agreed
and followed-up |
3
June 2019 |
6.2 Solid and Liquid Waste Management
Status
The
Contractor has been registered as a chemical waste producer for the Project.
Construction and demolition (C&D) material sorting was carried out on site.
A sufficient number of receptacles were available for
general refuse collection.
As advised
by the Contractor, no inert C&D material (i.e. broken concrete/ big
boulders) were generated on site and sent to a sorting facility for recycling
into rockfill. No metals were generated and collected by registered recycling
collector. No paper/cardboard packing and no plastics were generated on site
and collected by registered recycling collector. No chemical waste was
generated and collected by licensed chemical waste collector. No other types of
wastes (e.g. general refuse) were generated on site and disposed of at public
landfill facility.
The
Contractor is advised to maintain on site waste sorting and recording system
and maximize reuse / recycling of C&D wastes, whenever these are generated.
6.3 Status of Environmental Licences and
Permits
The environmental
permits, licences, and/or notifications on environmental protection for this
Project which were valid during the reporting period is summarised in Table 6.2.
Table 6.2: Status of Environmental
Submissions, Licences and Permits
|
Statutory
Reference |
Description |
Permit/Reference
No. |
Status |
|
EIAO |
Environmental
Permit |
EP-311/2008/E
|
Valid |
|
APCO |
Notification
of Construction Work under APCO |
316688
(27 Apr 2010) |
Valid |
|
WPCO |
Discharge
Licence |
WT00022647-2015
(8 Oct 2015) |
Valid |
|
WDO |
Registration
as Chemical Waste Producer |
WPN0000-542-H3083-04 |
Valid |
|
WDO |
Bill
Account for Disposal |
700945423 |
Valid |
Legend:
EIAO – Environmental Impact Assessment Ordinance; APCO – Air Pollution Control Ordinance;
WPCO –Water Pollution Control Ordinance; WDO – Waste Disposal Ordinance
6.4 Recommended Mitigation Measures
The
EM&A programme followed the recommended mitigation measures in the EM&A
Manual. The EM&A requirements as well as the summary of implementation
status of the environmental mitigation measures are provided in Appendix L. In
particular, the following mitigation measures were brought to attention
during the site audits.
Air
Quality
● Dark smoke emission from
equipment/plant should be avoided.
Noise
● The noise barriers and hoardings
should have no gaps and openings to avoid noise leakage.
Water
Quality
● Site effluent should be discharged
in accordance with discharge licence.
● The site should be confined and
properly maintained to avoid silt runoff.
● Chemicals will always be stored on
drip trays or in bunded areas.
Waste
Management
● The chemical waste storage area
should be clearly labelled.
● General refuse should be stored in
enclosed bins or compaction units separate from C&D and chemical wastes.
7.1 Record of non-compliance of Action and
Limit Levels
There was
no breach of Action or Limit Levels for Air Quality and Noise monitoring in the
reporting month.
During May
2019, a total of one Limit Level exceedances were observed. One Limit Level
exceedance of SS was recorded at MP4.
A summary
is presented in Table 7.1 below.
Table 7.1:
Summary of Exceedances in Water Quality
|
Monitoring
Date |
pH |
Dissolved
Oxygen (DO) (mg/L) |
Turbidity
(NTU) |
Suspended
Solids (mg/L) |
|
MP4 |
|
|
|
|
|
18/5/2019 |
7.1 |
6.6 |
56.8 |
58.5 |
|
Action
Level |
<5.5
or >7.5 |
<3.91 |
>60 |
>50 |
|
Limit
Level |
<4.0
or >8.0 |
<3.82 |
>64 |
>53 |
Notes:
(1) “<2”: Value is too low to indicate
(<2mg/L).
(2)
Values in Bold indicate Action Level exceedance.
(3)
Values Underlined and in Bold indicate Limit Level exceedance.
7.2
Record on Environmental Complaints Received
No
environmental complaint was received during the reporting month.
7.3
Record
on Notifications of Summons and Successful Prosecution
No
notifications of summons or successful prosecution were received the reporting
month.
7.4
Review
of Reasons for and Implications of Non-compliance, Complaints, Summons and
Prosecutions
Non-compliance
Investigations
have been carried out to identify the causes of the water quality exceedances.
The
investigation findings are presented in Section 3.2.3.1. It was
concluded that the abovementioned exceedances were unlikely to be due to the
construction works and therefore not considered to be related to the project.
Complaints,
Summons and Prosecutions
Not
applicable for this reporting month.
7.5
Follow-up
Actions Taken
Non-compliance
As
non-compliances have been recorded, the Event and Action Plan has been
followed. Although it is considered that the exceedances were not related to
the Project, the Contractor was reminded to implement the water quality
mitigation measures in accordance with the recommendation stated in Section
5.6.1 – 5.6.4 of the EIA Report as far as practicable and regular spot check would be conducted on the nearby discharge by the
Contractor and he would inform the ET for investigation.
Complaints,
Summons and Prosecutions
Not
applicable for this reporting month.
7.6
Cumulative
Statistics for Complaints, Notifications of Summons and Successful Prosecutions
Cumulative
statistics for complaints, notifications of summons and successful prosecutions
for the Project account for period starting from the date of commencement of
construction (i.e. 12 May 2010) to the end of the reporting month and are
summarized in Table 7.2 below.
Table 7.2: Statistics for
Complaints, Notifications of Summons and Successful Prosecution
|
Reporting
Period |
Cumulative Statistics |
||
|
Complaints |
Notifications of
Summons |
Successful
Prosecutions |
|
|
This reporting
month (May 2019) |
0 |
0 |
0 |
|
From
12 May 2010 to end of the reporting month (May 2019) |
8 |
0 |
0 |
8.1 Site Preparatory Works and
Construction Works for the Coming Month
The major site
works to be commissioned in the coming month include:
● Regular maintenance work for the
Wetland Restoration Area (including lowering of the water level and removal of
unwanted species in the pond)
● No major construction works
8.2
Key
Issues for the Coming Months
Key issues
to be considered in the coming three months include:
● Provision of water spraying or dust
suppression chemical to prevent generation of dust from activities on-site and
the haul road during dry weather conditions;
● Provision of wheel washing
facilities at vehicle exit point;
● Generation and treatment of site
surface runoffs and wastewater from activities on-site and during wet weather
conditions;
● Sorting, recycling, storage and disposal
of general refuse and construction waste from activities on-site; and
● Management of chemicals and
avoidance of oil spillage on-site and to the drainage system.
8.3
Monitoring
Schedule for the Coming Month
The
environmental site inspection and environmental monitoring will be continued in
the coming month. Impact monitoring for air, noise, water quality,
ecology and landscape and visual in accordance with the approved EM&A
Manual has commenced since 12 May 2010. The tentative monitoring schedule for
June 2019 is shown in the Table 8.1.
Table 8.1: Tentative Environmental
Monitoring and Audit Schedule for the Next Reporting Month

8.4
Conclusions and Recommendations
8.4.1 Conclusions
The
EM&A programme as recommended in the EM&A manual has been undertaken in
the reporting month since 12 May 2010.
Monitoring
of Air Quality, Noise, Water Quality, Ecology and Landscape and Visual impacts
due to the Project was under way. In particular, the
1-hr TSP, 24-hr TSP, noise level (as Leq)
and water quality parameters (such as pH, DO, turbidity and SS) under
monitoring have been checked against established Action and Limit levels.
There was
no breach of Action or Limit Levels for Air Quality and Noise monitoring in the
reporting month.
During May
2019, a total of one Limit Level exceedances were observed. One Limit Level
exceedance of SS was recorded at MP4.
8.4.2 Recommendations
With
considerations on the construction activities and environment, the following
recommendations were provided:
Air
Quality
● All stockpiles should be covered by
tarpaulin or kept wet by water spraying;
● All vehicles should be washed to
remove any dusty materials before leaving the construction sites;
● The portion of road leading the
construction site that is within 30m of a designated vehicle entrance or exit
should be kept clear of dusty materials;
● During the dry season, sufficient water spraying should be provided at haul road to
reduce dust emission; and
● Ensure proper functioning of the
wheel wash facility.
Noise
● Mobile plant should be sited as far
away from NSRs as possible;
● Plant known to emit noise strongly
in one direction should be orientated to direct noise away from the NSRs; and
● The construction activities should
be better scheduled to reduce noise nuisance.
Water
Quality
● Effluent should be discharged in accordance
with the discharge licence conditions;
● Soil contaminated with
chemicals/oils should be removed from site and the voids should be created
filled with suitable materials; and
● Silt and debris should be removed
from the temporary drainage channel regularly.
Waste
Management
● General refuse should be stored in
enclosed bins or compaction units separate from C&D and chemical wastes to
minimise odour, pest and litter impacts.
● Reuse the excavated materials as far
as practical to reduce the amount of waste disposal;
● C&D waste should be segregated
and stored in different containers to other wastes to encourage the re-use or
recycling of materials and their proper disposal;
● Ensure drip trays are provided for
chemical containers to prevent leakage or soil contamination;
● All plants and vehicles should be
properly maintained to prevent oil leakage; and
● Oil stains on soil should be cleared
by disposal of contaminated soil.